Two central banks, one pair
How the Fed and the BOJ together decide whether USDJPY ranges or breaks, and why that matters more than direction.
August 29, 2026
Ask most people what drives a currency pair and they will talk about the chart. Support, resistance, momentum, the last few candles. That is not wrong, exactly. It is just downstream of something bigger.
A currency pair is a relationship between two central banks. USDJPY is the price of the Federal Reserve's policy expressed in the Bank of Japan's. Everything the chart shows is the market working out what that relationship is worth today and what it might be worth next year. If you want to understand the pair, start with the two institutions, not the two lines.
The spread is the story
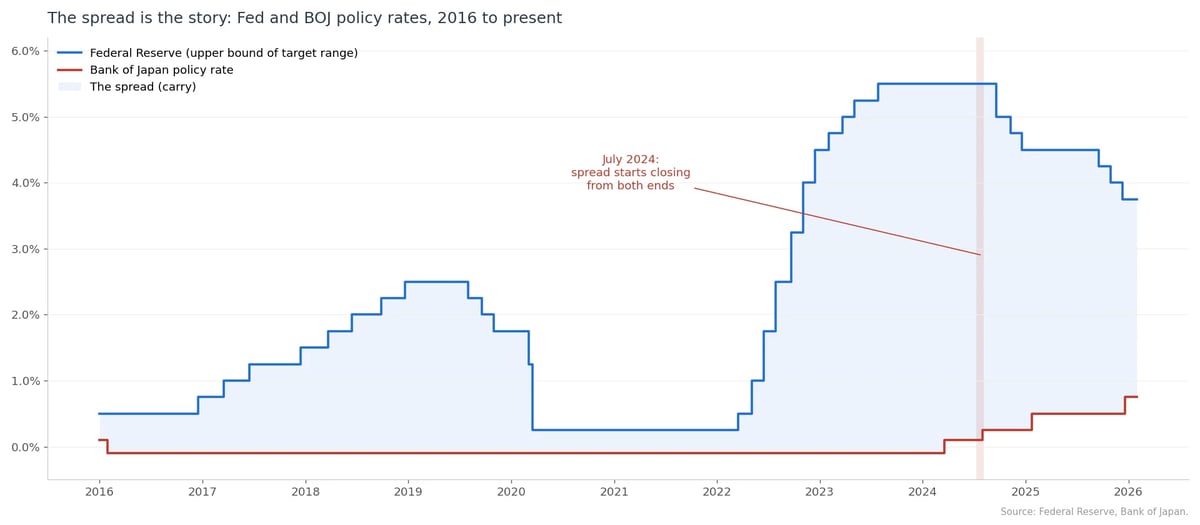
The Fed sets the cost of dollars. The BOJ sets the cost of yen. The gap between those two rates is the carry: the return an investor earns for borrowing in the cheap currency and holding the expensive one.
For most of the last two decades that gap ran in one direction. The BOJ held its policy rate at or below zero from 2016 onward, and near zero for years before that, while the Fed moved through full cycles. The result was one of the largest and most persistent positions in global markets. Borrow yen, buy dollars, collect the difference. Millions of participants, from Japanese households to global macro funds, were on the same side of it.
When the spread is wide and the outlook for it is stable, that position is comfortable. Capital flows into the dollar at a steady pace. Dips get bought because the carry pays you to wait. The pair does not go far in either direction. It ranges, sometimes with a drift, around a centre that moves slowly.
When the spread looks likely to narrow fast, the position becomes uncomfortable all at once. Nobody wants to be the last one out of a crowded trade. The pair does not correct. It unwinds.
Two regimes, not one market
Those are two different markets that happen to share a ticker.
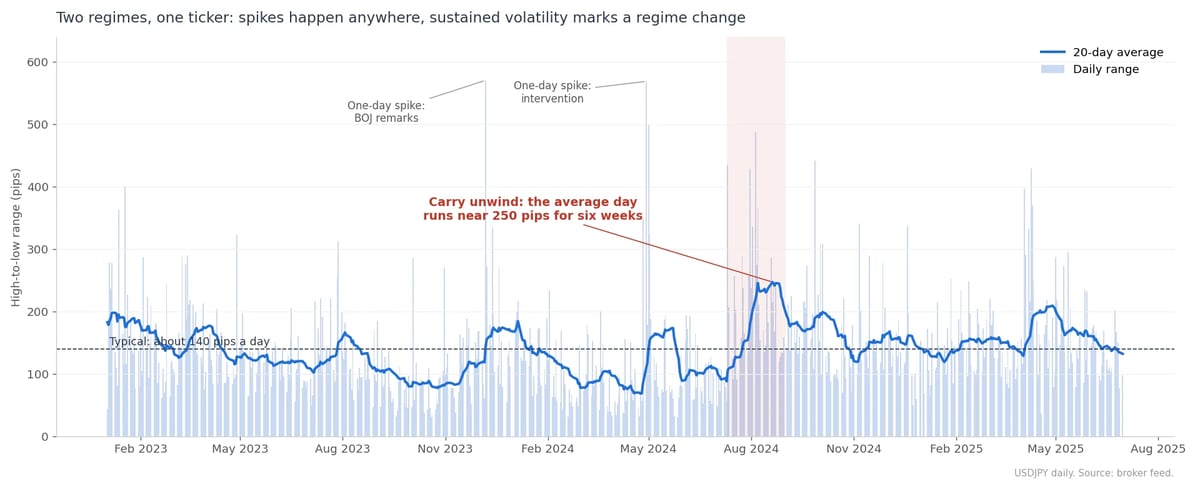
In the first regime, USDJPY behaves like a range-bound instrument with a bias. Volatility is moderate, moves revert, and patience is rewarded. In the second, the pair behaves like a trending instrument in a hurry. Volatility jumps, moves extend, and anything built for the first regime is in trouble.
The transition between them is not gradual. It is a step. And it is almost always triggered by a change in what the market believes about one of the two central banks.
2022 to 2024: a case study in the spread widening
In March 2022 the Fed began the fastest hiking cycle in forty years, taking its policy rate from near zero to above five percent by July 2023. The BOJ did not move. The spread went from almost nothing to more than five percentage points in sixteen months.
USDJPY did what the spread told it to. It rose from around 115 to above 150 by the autumn of 2022, prompting the first Japanese intervention since 1998. It corrected, then rose again through 2023 and into 2024, reaching 160 by the spring. Tokyo intervened again. The pair kept climbing.
Through all of that, the regime was stable. The spread was wide and expected to stay wide. Every dip was a chance to re-enter the carry. It was a trending market in the long run and a ranging market week to week, and the two were not in conflict.
July 2024: the spread compresses
Then two things changed at once.
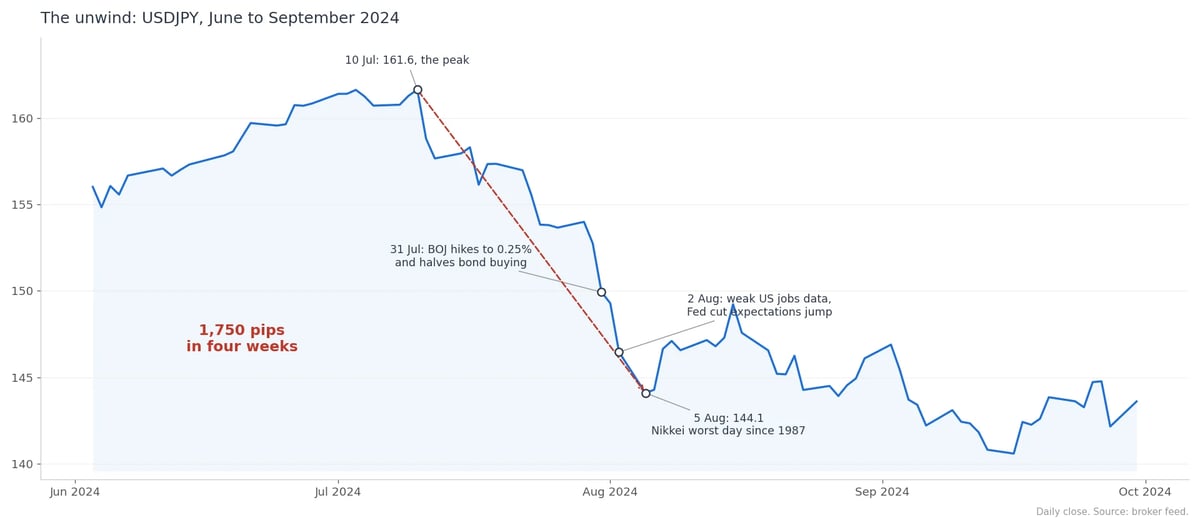
The BOJ, which had ended negative rates in March 2024, signalled it was prepared to keep going. On the last day of July it raised its policy rate to 0.25 percent and outlined a plan to halve its bond purchases. At the same time, weak US labour data pulled Fed rate-cut expectations forward sharply.
The spread that had been stable for two years suddenly looked like it was about to close from both ends. The carry trade, which had been the most crowded position in the world, began to unwind.
USDJPY fell from above 161 in mid-July to just above 141 in early August. Roughly 1,750 pips in four weeks. On a single day in early August the pair moved more than it had in some entire months of 2023. Equity markets in Japan had their worst session since 1987. Positions that had earned steadily for two years were wiped out in days.
None of that was visible on a chart in June. All of it was visible in the policy trajectory of the two central banks, for anyone who was watching them rather than the price.
Why regime matters more than direction
Here is the point that most commentary misses.
For a discretionary trader, direction is everything. Up or down, long or short. For a systematic strategy, direction is often secondary. What matters is whether the market is oscillating or running, because that determines which tools work and which ones fail.
A strategy built for ranges can be indifferent to direction and still do well, right up until the range breaks. A strategy built for trends can catch the break and give it all back grinding sideways for the following year. The question that decides survival is not "which way" but "which regime, and how close is it to changing."
That question cannot be answered from the chart alone. The chart shows the regime you are in. It does not show the one you are about to enter. The central banks do, because regime changes in USDJPY are policy events before they are price events. The information arrives in speeches, meeting minutes, forward guidance, and the front end of the yield curve, weeks before it arrives in the candles.
What this means in practice
We treat the two regimes as different markets and ask one question continuously: which one is the pair in, and what would it take for that to change. The answer comes from the policy trajectory of the Fed and the BOJ and from what the market is pricing ahead of them. It does not come from patterns on a chart.
Positioning follows from the answer. In a stable regime, patience. As the regime looks likely to turn, exposure comes down and protection takes priority over participation. The specific tools that make that judgement are proprietary. The logic is not, and it is the logic that matters: read the central banks first, then trade what the read allows.
Since July 2024 the BOJ has continued to raise rates and the Fed has continued to lower them. The spread is narrower than it was and still wider than it has been for most of this century. The pair has recovered much of the ground it lost. Whether that recovery is a new stable regime or an extended pause depends, as it always has, on two institutions in Washington and Tokyo. That is where our attention stays.
Precision Pulse Capital publishes research commentary for educational purposes. Nothing here is investment advice, a recommendation, or an offer. Trading foreign exchange on margin carries a high level of risk, including the possible loss of all capital.